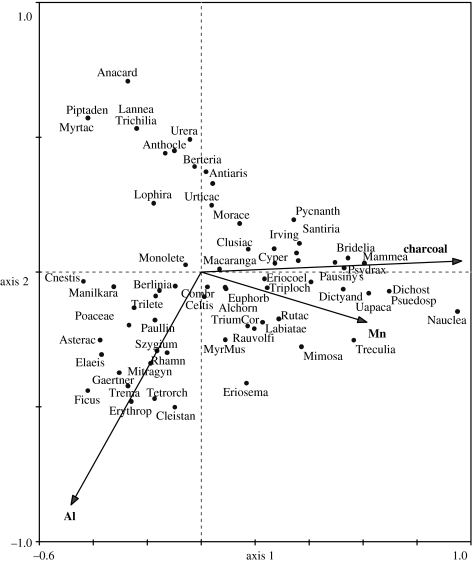
Figure 6.
CCA ordination diagram (axes 1 and 2) of pollen taxa and microscopic charcoal, Al and Mn. Axes 1 and 2 explain 23.3 and 12.8% of the total variability, respectively. Taxa names are abbreviated from the pollen diagram in figure 5. For clarity, not all pollen taxa are shown.

