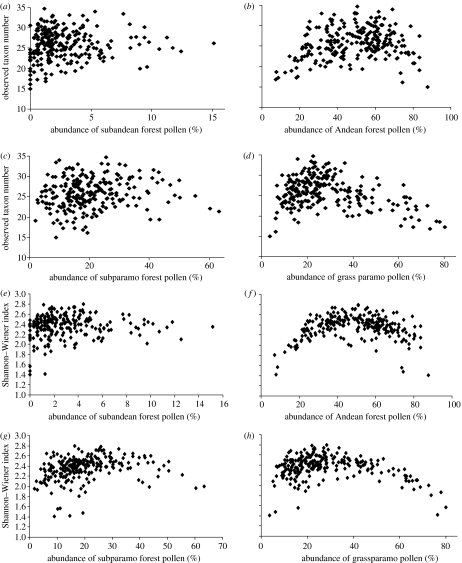
Figure 4.
Scatter diagrams showing the relationship between the observed pollen diversity and the relative abundance (percentage) of pollen from different altitudinal vegetation zones in the Fuquene-7C core (85 000–0 ka): (a)–(d) observed number of pollen taxa versus (a) subandean forest; (b) Andean forest; (c) subparamo; and (d) grassparamo. (e)–(h) Shannon–Wiener index versus (e) subandean forest; (f) Andean forest; (g) subparamo; and (h) grassparamo. The observed pollen taxon number is calibrated using a rarefaction method based on 300 pollen grains.

