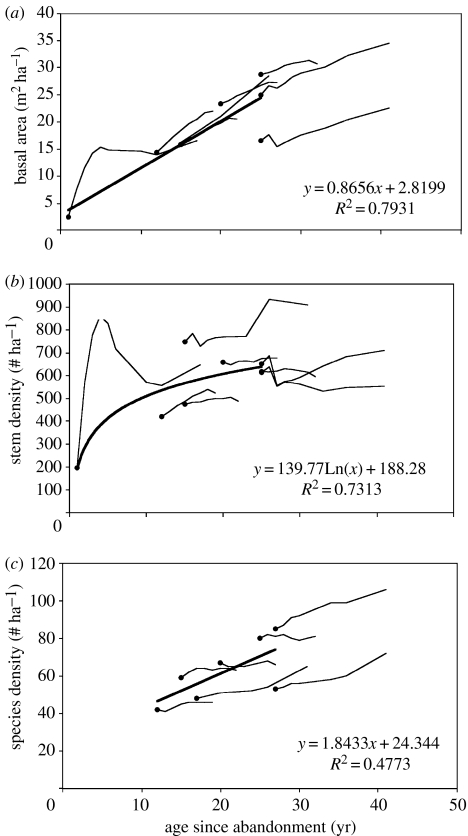
Figure 1.
Chronosequence data for trees greater than or equal to 10 cm DBH in eight secondary forest monitoring plots in northeastern Costa Rica (black dots) and successional trajectories within the same set of plots. (a) Basal area (m2 ha−1); (b) stem density (number of stems ha−1); and (c) species density (number of species ha−1). Data on species density were available for only seven plots (each 1 ha).

