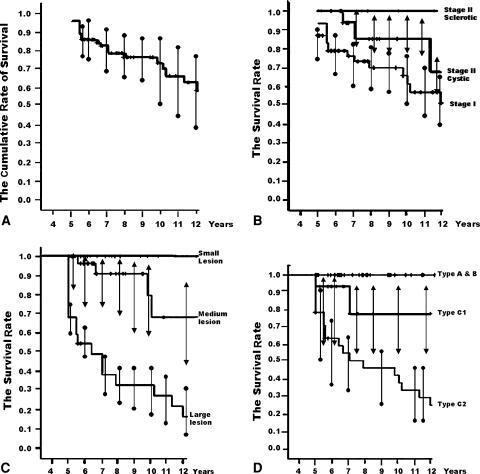
Fig. 1A–D.
The Kaplan-Meier survivorship curve. (A) The cumulative rates of survival (with 95% confidence intervals) are 91.4% at 5 years, 76.5% at 8 years, and 70% at 10 years with collapse of the femoral head as the end point. Error bars show the 95% confidence interval. (B) Survival rates according to initial Steinberg stages of osteonecrosis. There were no differences (p = 0.060, log-rank test) in survival among hips classified as Steinberg stages. Error bars show the 95% confidence interval. (C) Survival rates according to initial extent of the osteonecrosis by MRI using the method of Steinberg et al. [25]. The times to collapse were different (p = 0.000, log-rank test) among the three groups. Error bars show the 95% confidence interval. (D) Survival rates according to the location of osteonecrosis. The times to collapse were different (p = 0.000, log-rank test) among the three groups. Error bars show the 95% confidence interval.

