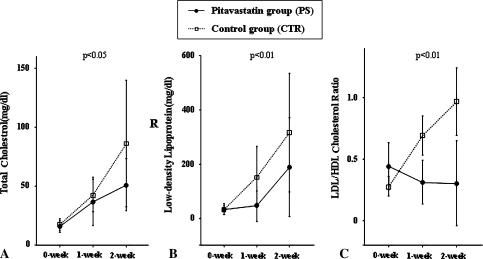
Fig. 3A–C.
Levels of total cholesterol (TC) and LDL and the ratio of LDL cholesterol to HDL cholesterol in the control and pitavastatin groups are shown. The timing just before the MPSL injection is indicated as 0-week. (A) The TC levels in the pitavastatin group were lower (p = 0.001) than those in the control group throughout the experimental period. (B) The levels of LDL cholesterol in the pitavastatin group remained lower (p < 0.0001) than those in the control group throughout the experimental period. (C) The pitavastatin group exhibited a lower (p < 0.0001) than average plasma LDL:HDL cholesterol ratio across the experimental period in comparison to the control group.

