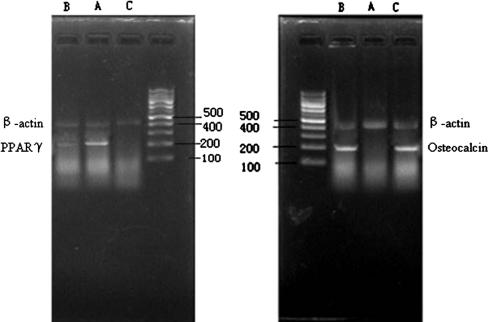
Fig. 5.
Electrophoresis of PPARγ and osteocalcin mRNA in the femoral head of mice shows expression of PPARγ mRNA in the tissue of both (B) the experimental group and (C) the control group was lower (p < 0.05) than that in the tissue of (A) the model group. Expression of osteocalcin mRNA in the tissue of both the experimental group and control group was higher (p < 0.01) than the model group, and there was no difference (p > 0.05) between the experimental and control group.

