
Figure three.
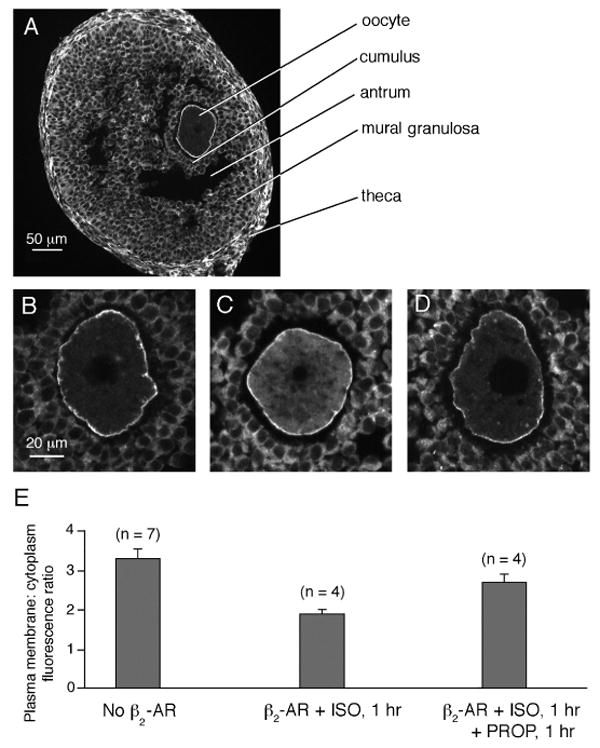
Translocation of endogenous Gαs in antral follicle-enclosed oocytes in response to activation and inactivation of an exogenously expressed β2 adrenergic receptor. A. Immunofluorescence image of a cryosection of an antral follicle labeled with an antibody against Gαs. Gαs is present in the oocyte, as well as the cumulus cells, mural granulosa cells, and theca cells. The black space within the oocyte cytoplasm is the prophase nucleus. The black space between the mural granulosa cells and the cumulus cells is the fluid-filled antrum. For immunoblots demonstrating antibody specificity, and for images illustrating the absence of significant fluorescence in sections stained with nonimmune IgG, see Freudzon et al. (2005). B. A magnified view of the oocyte from another follicle like that shown in A. C. An antral follicle-enclosed oocyte expressing the β2-adrenergic receptor and treated for 1 hour with 10 μM isoproterenol, then fixed and cryosectioned for Gαs immunofluorescence imaging. D. An antral follicle-enclosed oocyte expressing the β2-adrenergic receptor and treated for 1 hour with 10 μM isoproterenol, followed by 1 hour with 10 μM propranolol, then fixed and cryosectioned for Gαs immunofluorescence imaging. E. Plasma membrane:cytoplasm Gαs immunofluorescence ratios in antral follicle-enclosed oocytes for each of the conditions shown in the images above the graph (mean ± SEM, n = number of oocytes): no β2-AR (3.3 ± 0.24); β2-AR + ISO (1.9 ± 0.11); β2-AR + ISO + PROP (2.7 ± 0.21). The value for β2-AR + ISO is statistically different from both of the other values (unpaired t-test, p < 0.04), but the value for β2-AR + ISO + PROP is not different from the value for no β2-AR (p = 0.13). (Note that the absolute values of the ratios seen in the optical sections of isolated oocytes in Fig. 2 are artifactually higher than those seen in the physically sectioned specimens in Fig. 3, due to an optical effect as previously described (Freudzon et al., 2005)).