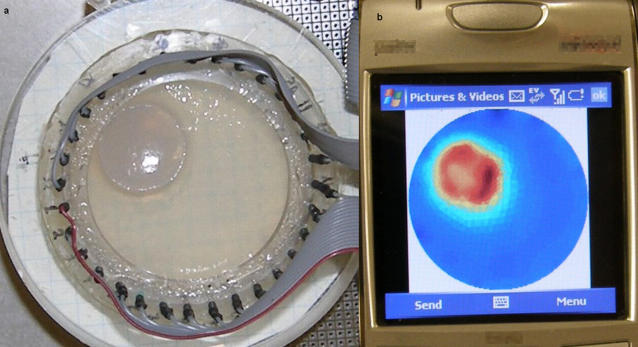
Figure 5. Breast cancer detection example.
a) The DAD of the system with two types of gel representing a breast cancer tumor surrounded by normal breast tissue. b) Reconstructed result as it was displayed on the screen of a commercial cellular phone. Warm colors represent higher conductivity regions that are typical of breast cancer lesions.

