
Figure 1.
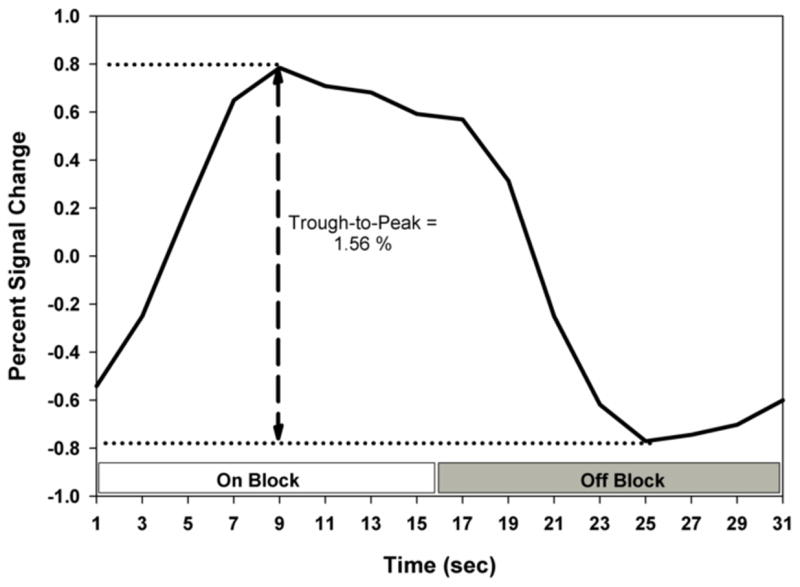
Illustration of the median percent signal change IRF and the trough-to-peak measurement. The on block and off block are indicated. The IRF in this figure is the average of six control non-smokers.
Official websites use .gov
A
.gov website belongs to an official
government organization in the United States.
Secure .gov websites use HTTPS
A lock (
) or https:// means you've safely
connected to the .gov website. Share sensitive
information only on official, secure websites.
Illustration of the median percent signal change IRF and the trough-to-peak measurement. The on block and off block are indicated. The IRF in this figure is the average of six control non-smokers.