
Figure 4.
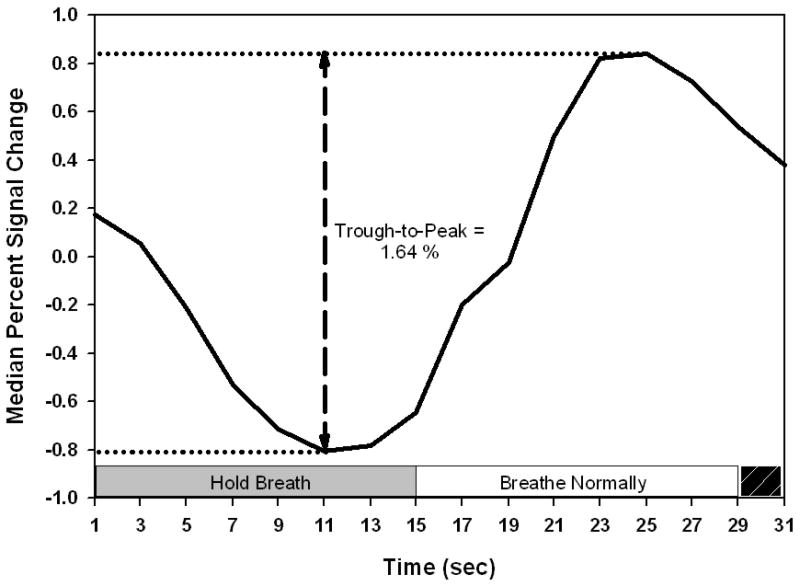
Illustration of the BOLD breath hold response and the median percent signal change (trough-to-peak) measurement. The breath holding period and the normal breathing period are indicated. The black stripped box in the lower right of this figure indicates the time when the subject was to inhale and prepare for the breath holding period. The IRF in this figure is the average of the six patient smokers.