
Figure 5.
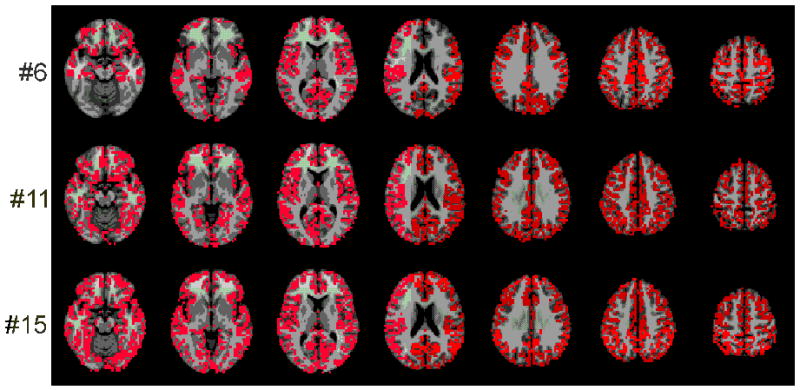
Three (of 20 total) representative ROIs for the breath hold task, chosen to show the range of ROI sizes. The voxels in the ROIs are shown in red. There were 20 subjects, with 1 ROI per subject. These 20 ROIs were rank ordered by size. The figure presents the 6th, the 11st and the 15th ROIs in this list. These are approximately the 25th, 50th and 75th percentiles, respectively.