
Figure 8.
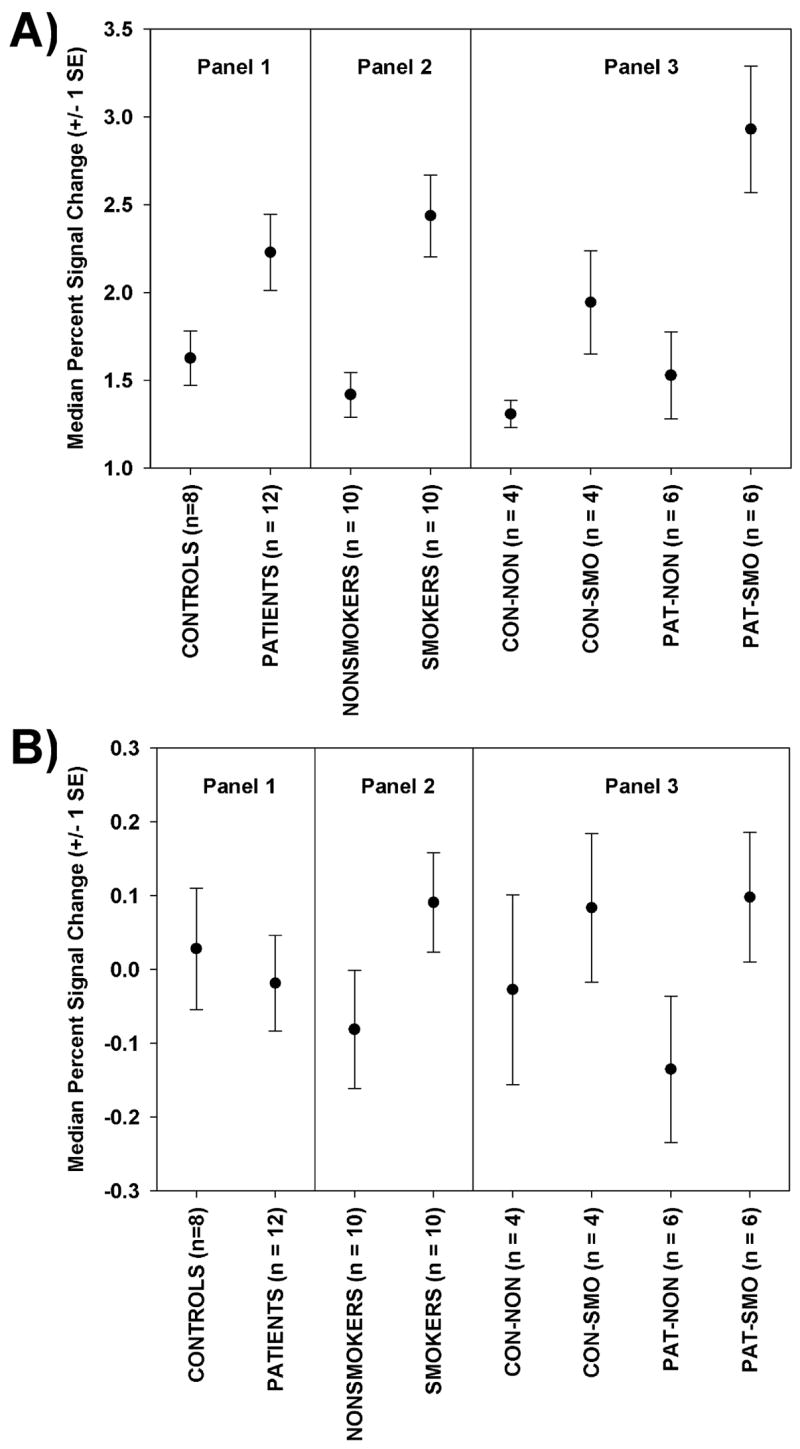
Plots of means and standard errors for: (A) the median percent signal change due to the breath hold task in the visual cortex ROI, and (B) residual median percent signal change after regressing median percent signal change due to the VA task onto the breath hold response in the visual cortex. Data are displayed in 3 panels: by diagnosis (Panel 1), by smoking group (Panel 2), and for all four groups (Panel 3)./