Figure 1.
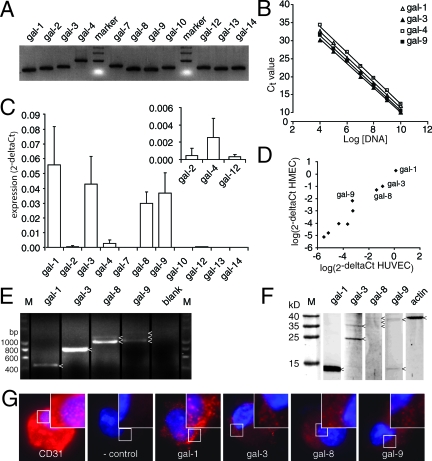
Galectin expression profile in endothelial cells. A: Agarose gel electrophoresis showing the length of the different galectin PCR amplicons. All primers generated a single band of the expected size. B: Analysis of primer sensitivity. The graph shows linear amplification with a slope of ∼−3.3 over a broad dilution range. Only galectin-1, -3, -4, and -9 are shown, but similar results were obtained for all galectins (see also Table 3). C: The galectin expression profile in freshly isolated HUVECs. Apart from the predominantly expressed galectin-1, -3, -8, and -9, expression was also detected for galectin-2, -4, and -12 (see inset). D: Scatterplot showing a strong correlation (r = 0.967, P < 0.001) between galectin expression in HUVECs (x axis) and human microvascular endothelial cells (y axis). Galectin-1, -3, -8, and -9 were expressed most abundantly. E: Agarose gel electrophoresis following PCR with full-length primers on HUVEC cDNA. Different amplicons are indicated with an arrowhead. As blank no primers were added to the PCR mix. F: Western blot analysis of galectin protein expression in HUVECs. Protein bands are indicated with an arrowhead. Actin served as control. G: Fluorescent microscopic pictures of galectin staining (red) in HUVECs after cytospin. As positive control, a CD31 antibody was used. In the negative control, the primary antibody was omitted. Cells were counterstained with 4′,6-diamidino-2-phenylindole to visualize the nucleus (blue). Original magnification, ×1000.

