Figure 3.
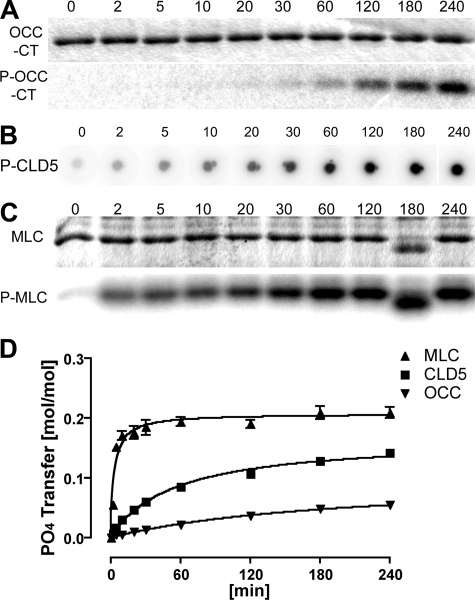
Time course of substrate phosphorylation by GST-RhoK. A and C: OCC-CT (5 μmol/L) or MLC (9 μmol/L, C) was incubated with 200 μmol/L [γ-32P] ATP (10 μCi) and purified 1-μg GST-RhoK in 100-μl volume for 0 to 240 minutes, and a 10-μl aliquot was mixed with Laemmli sampling buffer and boiled for 5 minutes at each time point. The samples were subjected to SDS-PAGE for CBB staining (top) and autoradiogram (bottom). B: The same condition was applied to CLD5-CT peptide (800 μmol/L, B), and 10-μl aliquots were spotted onto phosphocellulose membrane for each time point. After extensive washing, the membrane was subjected to autoradiogram. D: The time course of substrate phosphorylation by quantification of autoradiogram compiled from three independent experiments. y axis represents the number of phosphates transferred to each substrate (mol/mol).

