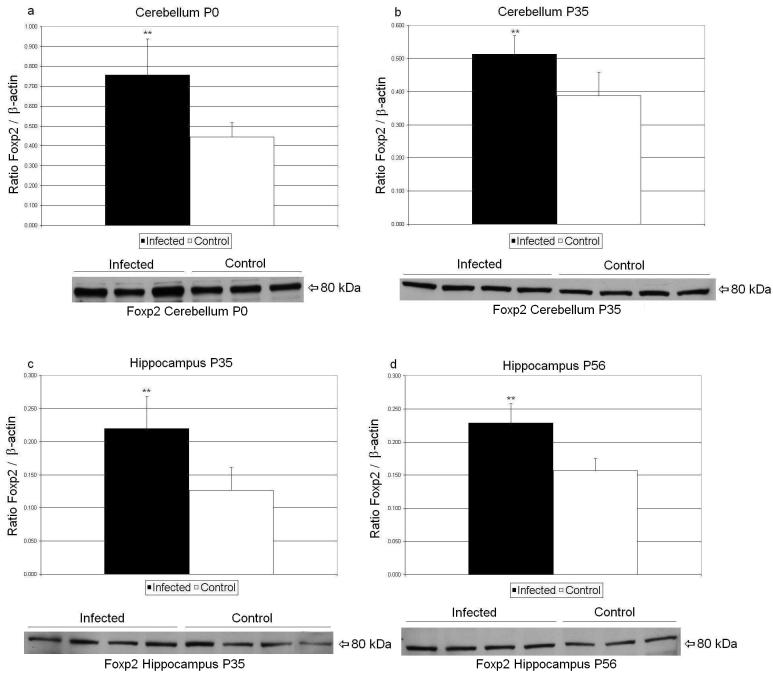
Figure 1.
Mean Foxp2/ β-actin ratios for the progeny of infected (filled histogram bars) and sham-infected mice are shown. Levels of Foxp2/ β-actin were significantly increased in P0 (a) and P35 (b) cerebellum (p=0.050 and 0.032 respectively) and in P35 (c) and P56 (d) hippocampus (p=0.036 and 0.022 respectively). Foxp2 bands from P0 and P35 cerebellum and P35 and P56 hippocampus homogenates (60 μg per lane) of representative progeny from sham-infected and infected mice are shown. **p < 0.05 vs. control.

