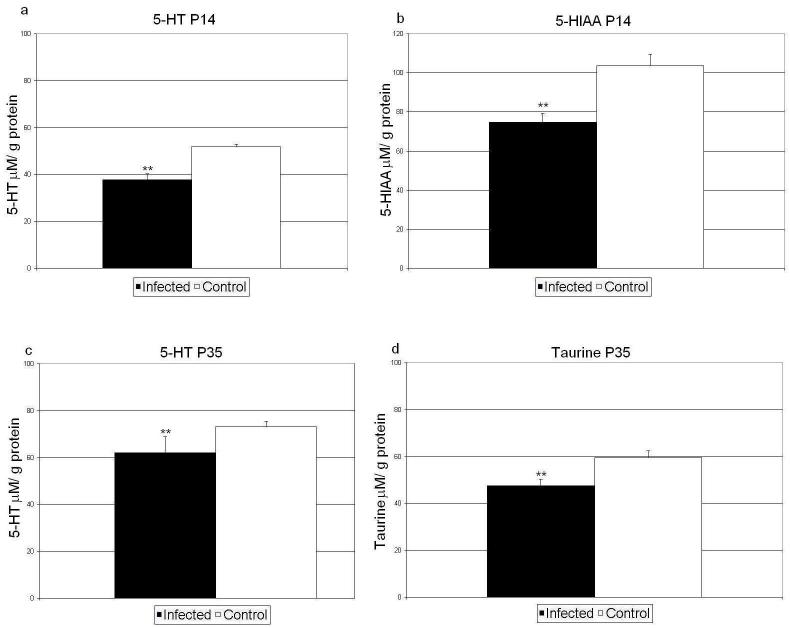
Figure 3.
Neurochemical analysis of offspring of mice infected on E18. Shown are mean values +/- SEM of the mean for serotonin (5-HT, a and c), 5-HIAA (b), and taurine (d). Statistical significance of difference analyzed by one way analysis of variance followed by Holm Sidak post hoc test. **p < 0.05 vs. control.

