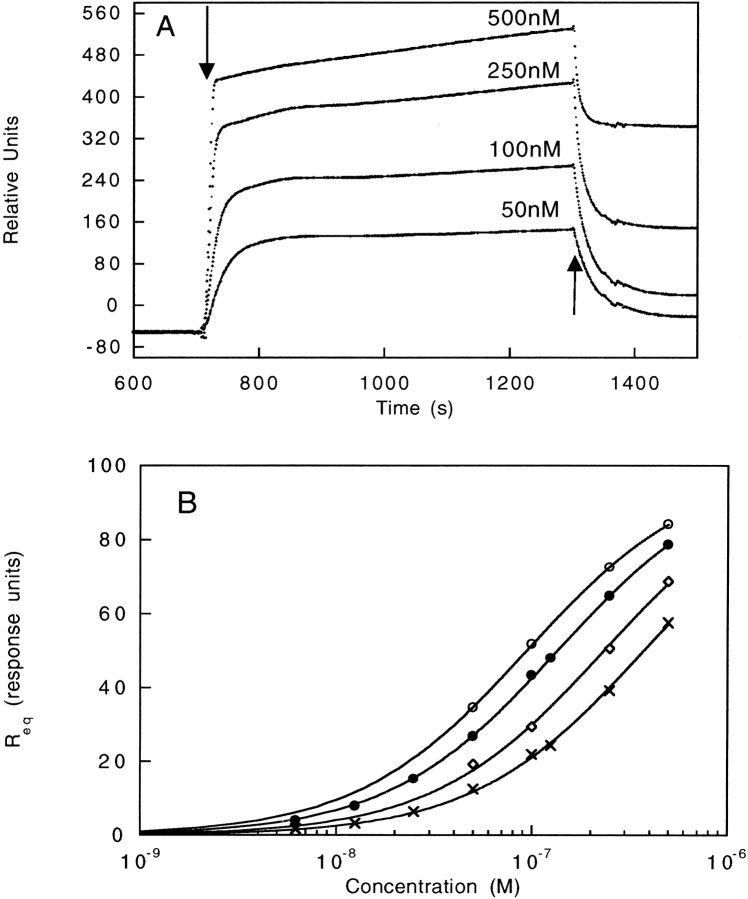
Figure 5.
(A) Raw data of SH2 binding to the phosphotyrosyl peptide from SPR experiments. Increasing amounts of the SH2 domain were injected over the immobilized phosphotyrosyl peptide chips. The arrows indicate the beginning and end of the injection. The signal from a reference cell with only biotin bound to the chip was subtracted from the raw data. (B) Binding curves of SH2 and SH2 insertion variants. SH2 (•), SH2[217] (○), SH2[333] (⋄), and SH2[425] (crosses). The equilibrium value taken from the raw data, Req, was plotted as a function of protein concentration. The solid line represents the fit of the data to the following equation: Req = Rmax ([SH2]/KD-[SH2]), in which Rmax is the signal observed upon maximum binding and KD is the dissociation constant. The plots were normalized to a Rmax of 100 response units (RU).

