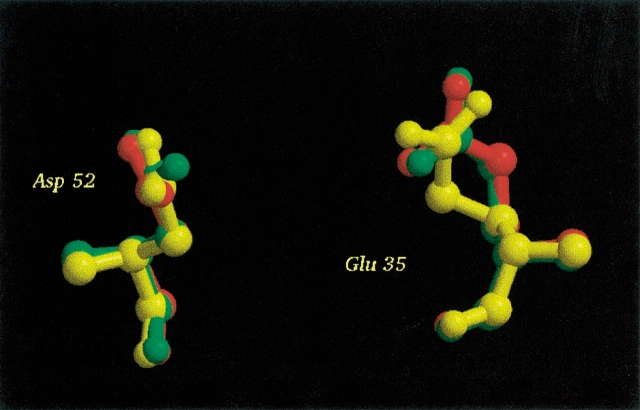
Figure 5.
Glu 35 and Asp 52 from 2LZT (red), 4LYT (green), and 7LYZ (yellow). Only very small differences between the positions of these two side chains are observed for these three structures. The figure was prepared with the MOLSCRIPT (Kraulis 1998) and Raster3D (Merrit and Bacon 1997) programs.

