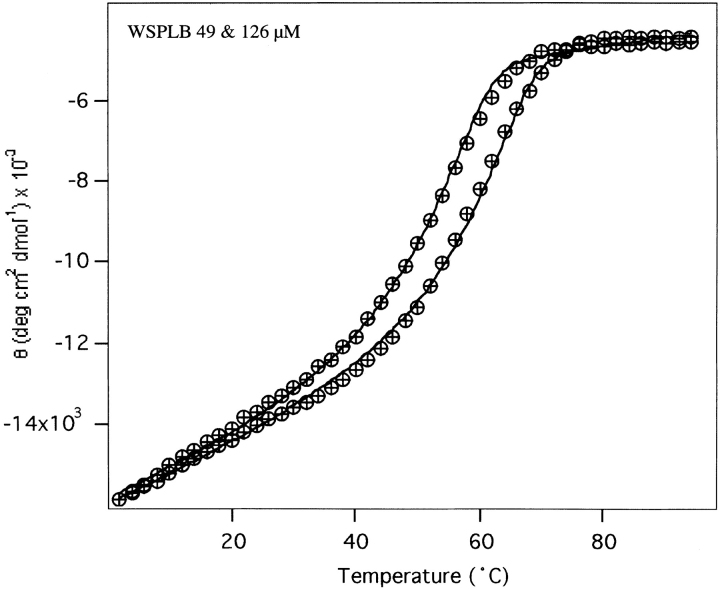
Figure 5.
Thermal denaturation of WSPLB, measuring the loss of signal at 222 nm with increasing temperature by circular dichroism. Scans taken with 60-s signal averaging time and equilibration of 4 min at each temperature. Concentrations of peptide are 50 and 125 μM. Data were fit to a two-state model (theoretical curves are shown) with a monomer–pentamer equilibrium.

