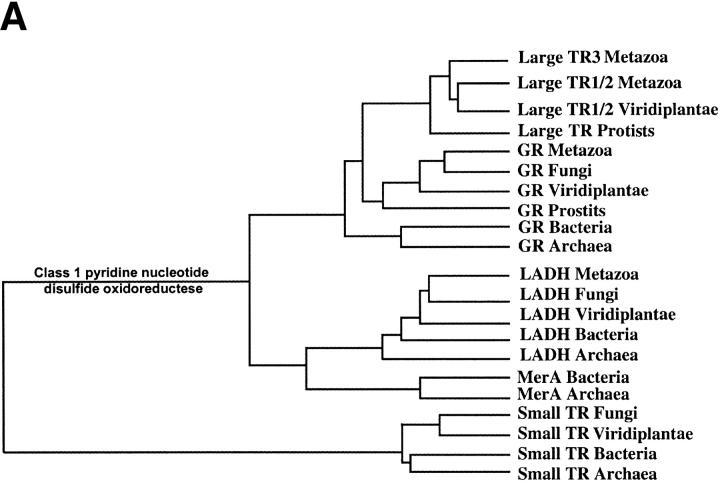
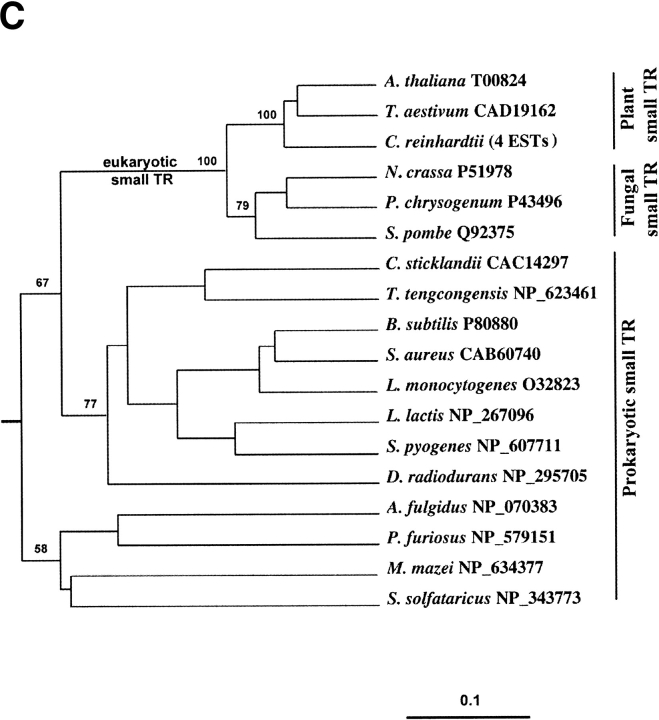
Figure 2.

Phylogenetic analysis of pyridine nucleotide disulfide oxidoreductase family. (A) Schematic representation of the tree that shows enzyme origins and consists of both class I (including large TRs) and class II (small TRs) pyridine nucleotide disulfide oxidoreductases. (B) Pyridine nucleotide disulfide oxidoreductase class I tree. Separation of prokaryotic and eukaryotic glutathione reductases (GR) and the origin of large TRs are indicated on the tree. Accession numbers are shown for each protein sequence, and those large TRs that are selenoproteins are indicated by stars. (C) Small TR tree. The trees were constructed using sequences with indicated accession numbers and a PileUP program (part of Wisconsin Package GCG) as described in Novoselov et al. (2002) and Kryukov and Gladyshev (2000). Support values are bootstrap proportion calculated using PHYLIP package; 100 bootstrap replicates (SEQBOOT program), Kimura distance correction method (PROTDIST program), UPGMA algorithm (NEIGHBOR program), and Majority Rule type consensus tree (CONSENSE program) were used. TR, thioredoxin reductase; GR, glutathione reductase; LADH, lipoamide dehydrogenase; MerA, mercuric ion reductase.


