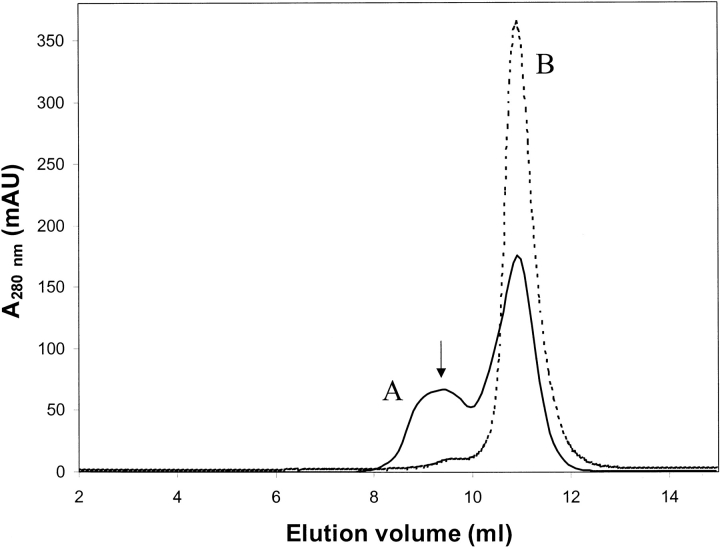
Figure 3.
Gel filtration chromatogram of purified DPCK. The dashed line depicts a gel filtration chromatogram from a Superdex 75 column with the DPCK protein in its purification buffer (see Materials and Methods). The solid line depicts a run using the buffer containing 0.2 M ammonium sulfate. The peak marked A is due to the trimeric form of the enzyme. The peaks B correspond to the monomer. The arrow in the figure marks the center of the observed elution peak for the molecular mass standard bovine serum albumin (molecular mass, 67 kD).

