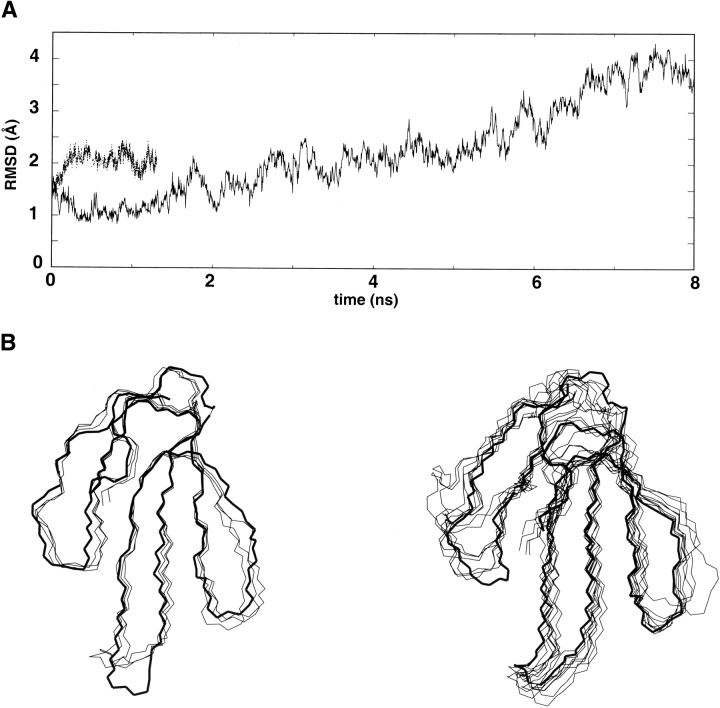
Figure 2.
Analysis of the molecular dynamics simulations of toxin α: (A) Variation of the root-mean-square deviation between the backbone atom positions along the trajectories relative to their initial positions (thin and thick lines correspond to trajectories started from NMR and X-ray structures, respectively). (B) Snapshots (one per ns) extracted from the trajectories started from the average NMR structure (left) and X-ray structure (right). The starting structures are represented in thick lines.

