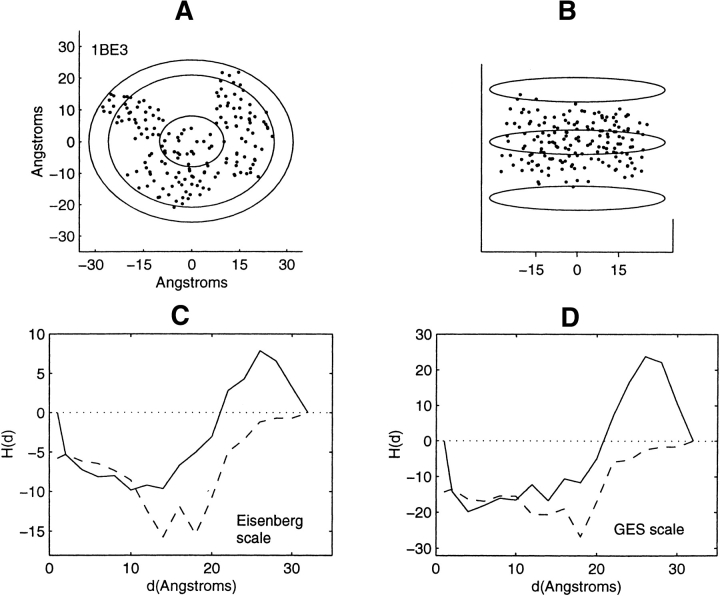
Figure 12.
Distribution of residue centroids and hydrophobicity profiles of the cytochrome Bc1 complex, 1BE3. (A) A view along the axis normal to the plane of the membrane. (B) A view canted by 80° from the symmetry axis. (C) The hydrophobicity profile H(d) calculated with the Eisenberg hydrophobicity scale. (D) The hydrophobicity profile H(d) calculated with the GES hydrophobicity scale. Both solid and dashed lines in C and D are calculated in steps of 2 Å. The solid line is calculated with the inclusion of the D helical chain; the dashed line is calculated with deletion of this chain.

