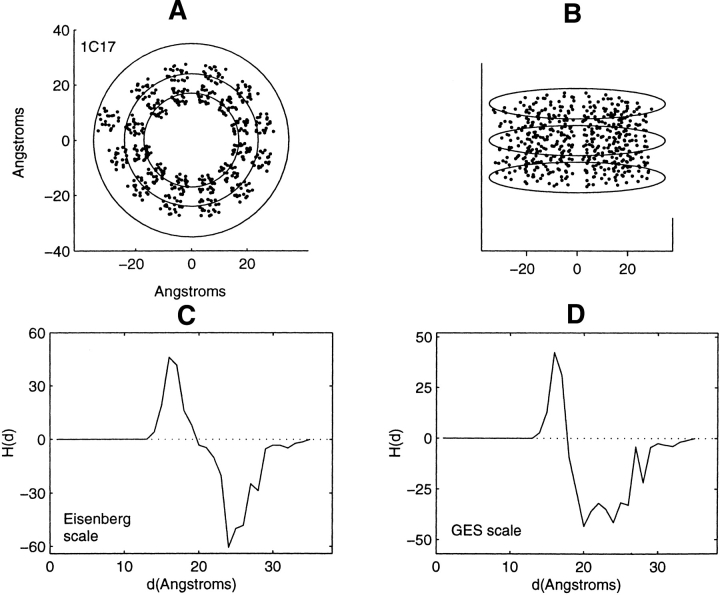
Figure 3.
Distribution of residue centroids and hydrophobicity profiles of the subunit C of the ATP synthase from Escherichia coli, 1C17. (A) A view along the C3 symmetry axis normal to the plane of the membrane. (B) A view canted by 80° from the symmetry axis. (C) The hydrophobicity profile H(d) calculated with the Eisenberg hydrophobicity scale. (D) The hydrophobicity profile H(d) calculated with the GES hydrophobicity scale. The solid lines in C and D are calculated in steps of 1 Å.

