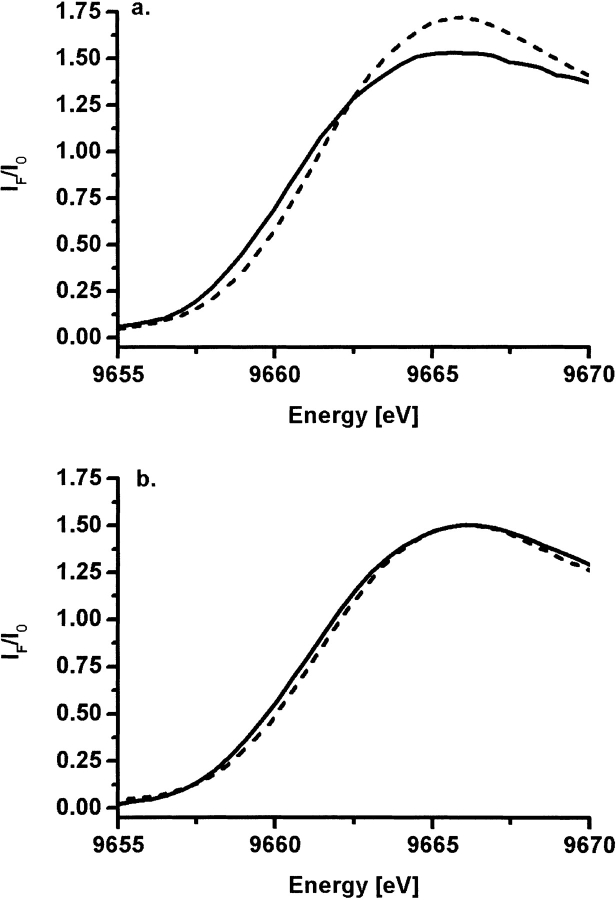
Figure 4.
Zinc K edge spectra of E60A-TbADH and E60D-TbADH. Raw normalized XAS data in the Zn K-edge region of E60A-TbADH (A) and E60D-TbADH (B) in the apo-from (solid line) and in complex with NADP+ + DMSO (dashed line). The edge position of both mutants was shifted to higher energy on binding of DMSO.

