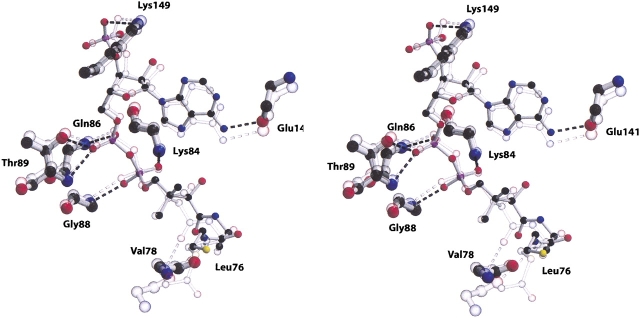
Figure 2.
A stereo ball-and-stick representation of the substrate binding site of the AAC(6′)-Ii enzyme. The figure includes both the complex with CoA (full color) and the superimposed structure of the AcCoA complex (partially transparent). The figure includes those residues that form hydrogen bond interactions with the cofactor (represented by broken lines). Carbon atoms are depicted in black, oxygen atoms in red, nitrogen atoms in blue, and sulfur atoms in yellow.

