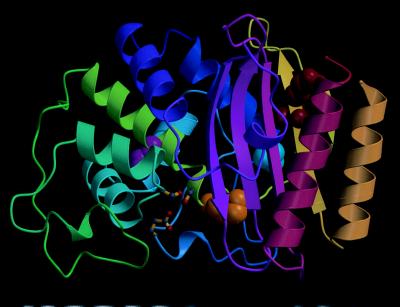
Figure 2.
Diagram of the TEM-1 β-lactamase structure (20) showing the positions of residues I47 and E48 (red), M69 (yellow), L76 (magenta), and M182 (cyan). The position of the active site is indicated by the ball-and-stick representation of the catalytic residues S70, S130, and E166. Figure was made using molscript (21).

