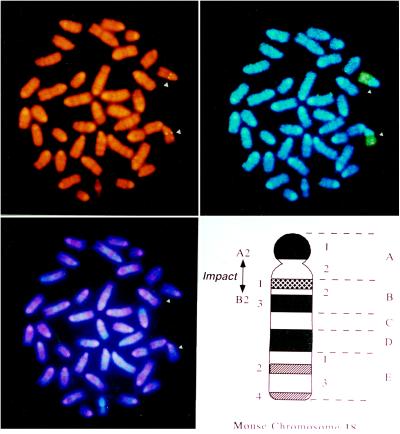
Figure 6.
Chromosomal localization of Impact revealed by fluorescence in situ hybridization. (Upper Left) Metaphase plate showing propidium iodide-stained chromosomes and hybridization signals. (Upper Right) G-banded chromosomes of the same cell. (Lower Left) The same cell rehybridized with a mouse chromosome 18-specific painting probe (Cambio). (Lower Right) Idiogram of mouse chromosome 18 illustrating the location of Impact at the region of 18A2-B2.

