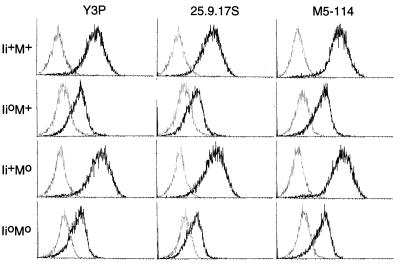
Figure 1.
Cell surface expression of MHC molecules. Splenocytes from mice of the phenotypes shown were stained using anti-Ab mAbs and analyzed by cytofluorimetry. The darker line represents the Ab specific staining on gated IgM+ B cells. The thin line represents background staining (secondary reagent alone).

