
Table 2.
Alcohol frequency regression results (n = 300)
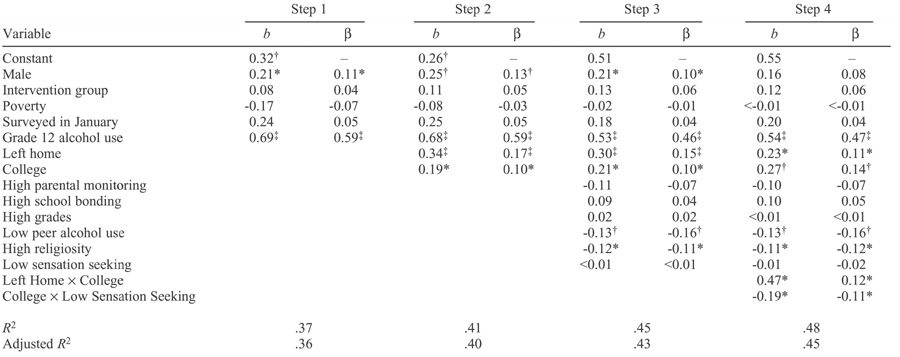 |
Notes: Outcome variable and lagged-dependent variables are natural log transformed. Interaction terms are centered. Only significant interactions are shown in Step 4.
*
p < .05;
†
p < .01;
‡
p < .001.