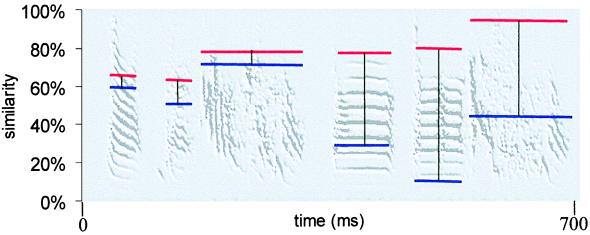
Figure 3.
Different chunks of the model song were imitated to different extents by juveniles that had limited (red line) or unlimited (blue line) access to the model. The horizontal lines correspond to the mean similarity score for each chunk for all the birds in that group. The vertical line offers a simple yardstick for each of these comparisons.

