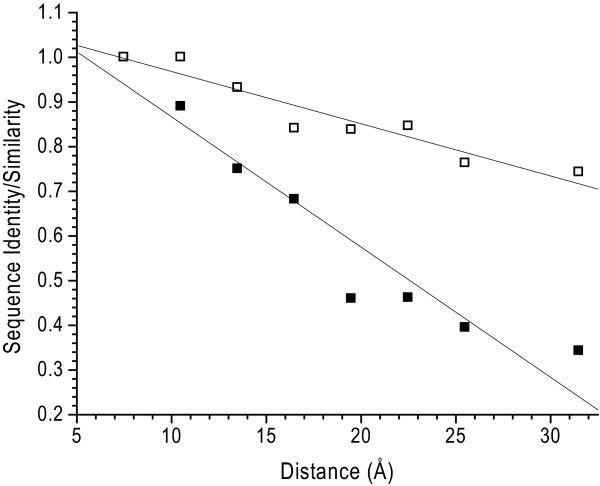
Figure 5.
Structure based sequence comparison of ecRBP and tteRBP. Comparison of sequence identities (black squares) and similarities (open squares) of tteRBP and ecRBP by scoring the number of identical residues in 3 Å concentric shells centered on the mid-point of the bound-ribose. The residues in the last two bins were combined due to the few members in the largest bin. In the primary complementary surface (first shell, 9 Å), the two sequences are identical; at the furthest distance the two sequences are 34% identical and 74% similar. Solid lines are a linear fit of the data to the observations.

