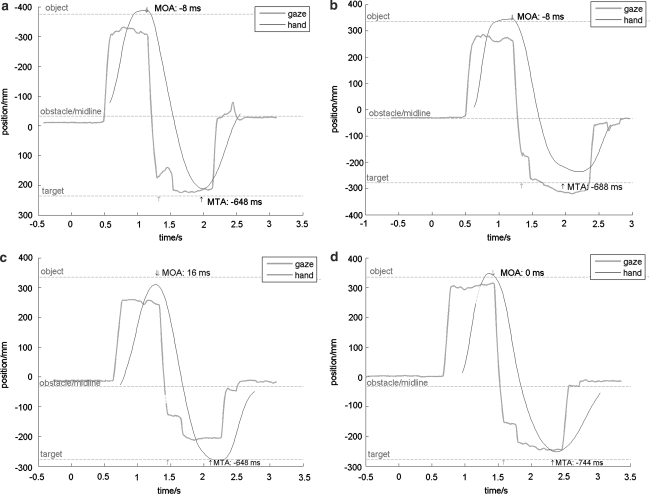
Fig. 2.
Sample trials of two control participants, using their PH (a, c) and NPH (b, c) in trials with the obstacle present. Interpolated data points are represented by dashed lines. Vertical arrows at the top and bottom of the plots specify the intervals defining the MOA and MTA (beginning/end of hand and eye movement), with numerical values of these measures added

