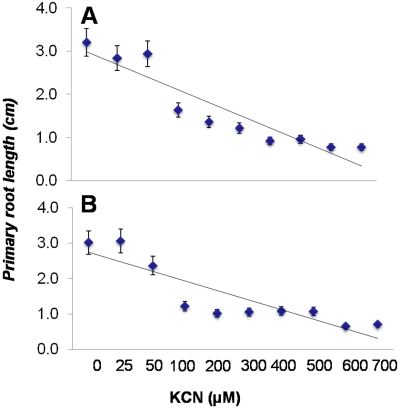
Figure 3. Direct and indirect effect of different doses (0–700 µM) cyanide on the growth of A. thaliana Col-0 seedling.
The data shows the linear regression plots (A&B) shows the predicted (line) and experimental (dots) values of primary root length at different concentrations of KCN(B; r 2 = 0.8581) and HCN (D; r 2 = 0.779). Data is the mean±SD of 12 replicates and the experiment was repeated on two independent occasions.

