
Figure 2. Comparison of models and data phenotypically mixed virus.
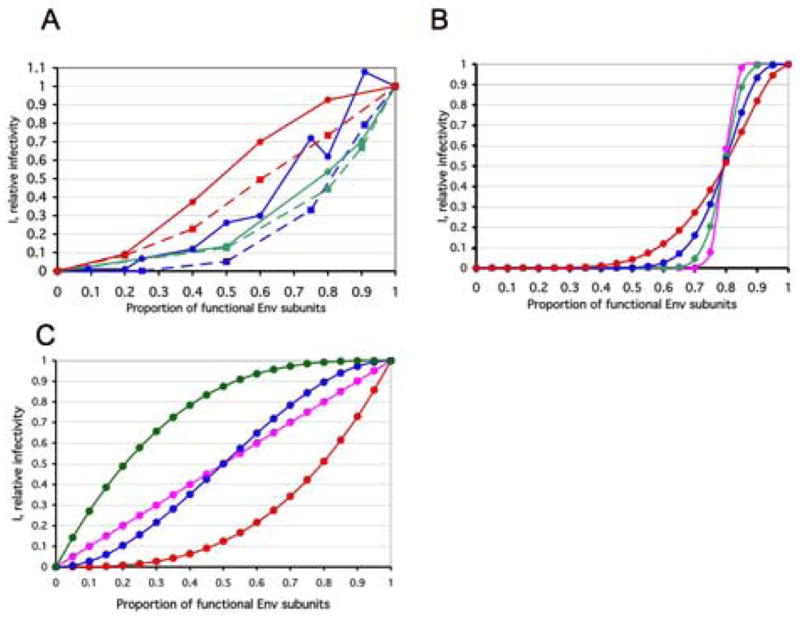
A. Data from four empirical studies were converted to a common format, for ease of comparison. All curves for PIs are continuous lines with circles; TCLA viruses are represented by stippled lines and squares. The data from two studies on phenotypically mixed cleavage-defective and cleavage-competent Env are represented by the blue curves; only data from experiments using Env with full-length cytoplasmic tails were included (Herrera et al., 2006; Yang et al., 2005b). The PI curve (blue continuous lines, circles) shows the pooling of data from the PIs YU2 (Yang et al., 2005b) and JR-FL (Herrera et al., 2006). (Neither a fusion-segment mutant (V513E) nor cytoplasmic-tail and matrix-protein mutants described in (Yang et al., 2005b) are included in the current re-analysis.) The data for the TCLA virus HXBc2 (Herrera et al., 2006) (blue stippled lines, squares) fall below. Two neutralization curves are shown in green (Yang et al., 2005a). The PI curve represents the mean of data for three strains and three NAbs (green continuous line, circles). The TCLA curve describes the mean of data on HXBc2 and 8 NAbs; it falls somewhat below (green stippled line, squares). The red curves show average data for viruses containing wild-type Env and Env with defects in receptor interactions (Yang et al., 2006a). The PI curve (red continuous line, circles) shows the mean of data for YU2 viruses containing Env with defects in either CD4 or CCR5 binding. The TCLA curve depicts the mean of data for HXBc2 viruses containing Env with defects in either CD4 or CXCR4 binding. Insufficient information is available to illustrate experimental variation or to separate it from biological variation. Data sets for some mutants and similar strains -- pooled here in order to indicate approximate trends -- were analyzed separately in the following.
B. The number of trimers per virion affects the slope of the curve
The diagrams show the relative infectivity on the y-axis as a function of the relative content of functional Env protein that is incorporated into the virions (x-axis). The steepness is determined by n, the number of functional trimers per virion at p=1: The absolute threshold, L, is assumed to be constantly the median, (n+1)/2, for four odd values of n from 3 to 81. In all four cases, one non-functional protomer per trimer is assumed sufficient for inactivating the trimer, i.e., S=1; n=3, L=2: red circles; n=9, L=5: blue circles; n=27, L=14: green circles; n=81, L=41: magenta circles.
C. Proportionally incremental models
Incremental models based on the assumption that virion infectivity is exactly proportional to trimer functionality are illustrated. They are independent of the value of n. The three special cases of protomeric thresholds at the trimer level, S=1 (red circles), S=2 (blue circles), S=3 (green circles) are illustrated. In addition, a protomeric incremental model, i.e., the absence of thresholds at both the trimer and virion levels, is shown (magenta circles). This function is also the average of those for S=1, S=2 and S=3. Mathematically, models of the extreme case of n=1 and T=1 will be identical to the incremental ones for S=1, S=2, S=3 here, but their interpretations and implications differ.