
Figure 3. Closeness of data to models along liminal-incremental spectra.
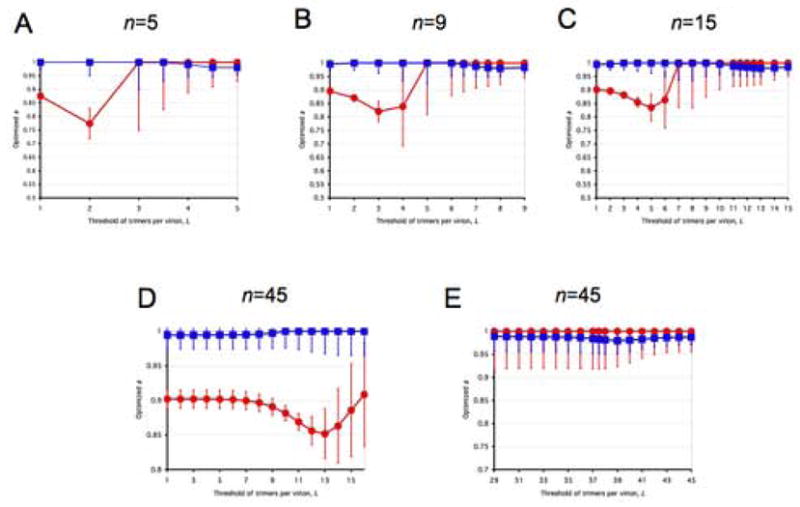
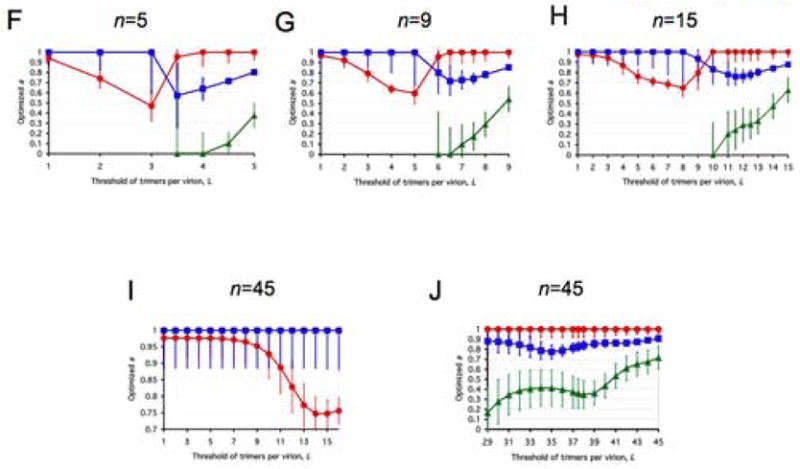
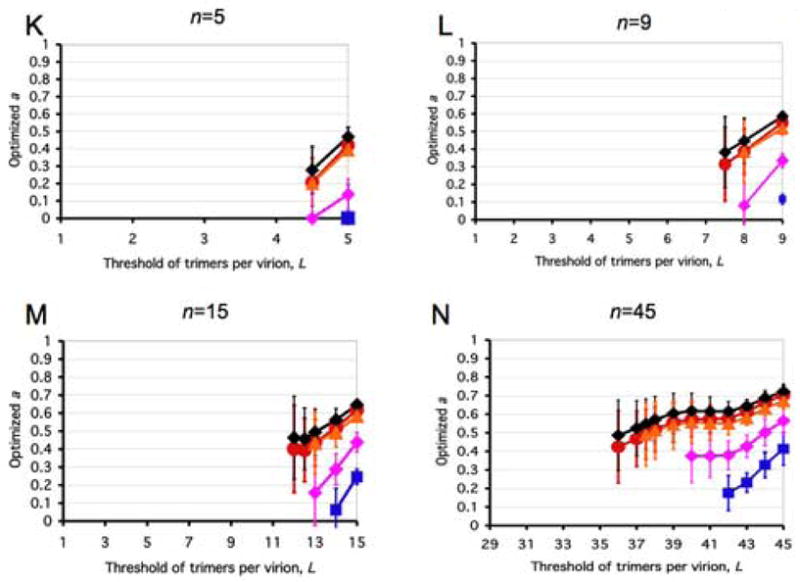
All panels represent spectra between one incremental and a variety of virion-level liminal models. Both the incremental and the liminal models have S=1 as a premise. Virions are postulated to have 5, 9, 15 or 45 potentially active trimers in total (n, marked above each diagram). The threshold of inactivation, L, in the liminal component of the model spectrum is depicted on the x-axis. On the y-axis, the value of the parameter a ± S.E.M, optimized by non-linear regression, is expressed for each value of L. The parameter a, constrained 0≤a≤1, gives the differential weights to the incremental and liminal components of the model spectra: the higher the value of a, the greater the incremental component; the lower the value of a, the greater the liminal component. Thus a minimum on the curve indicates the greatest proximity to the liminal function with that particular threshold. The R2 value corresponding to the minimum a value is invariably among the higher ones. But other adjacent thresholds, with a higher a, can sometimes give even higher R2 values. For some data (Yang et al., 2006a), the incremental and some liminal models fit so poorly that no good fit was found within the spectrum between them. Such a values giving R2 < 0.9 have not been plotted. Panels A–E show modeling of virus with mixed antigenic and non-antigenic Env in the presence of an excess of NAb (Yang et al., 2005a), the TCLA virus HXBc2 (mean of I for 8 NAbs, red circles) and the PIs YU2, ADA and KB9 (mean of pooled I for 2–3 NAbs, blue squares). Panels F–J show modeling of virus with mixed cleavage-defective and functional Env: the TCLA virus HXBc2 (Herrera et al., 2006) (red circles); the PI YU2 (Yang et al., 2005b) (blue squares) and the PI JR-FL (Herrera et al., 2006), green triangles. Panels K–N show viruses containing mixed mutant and wild-type Env, where the mutant is defective in CD4 binding, co-receptor interaction or gp41-fusion function (Yang et al., 2006a). The TCLA virus HXBc2 has varying proportions of Env defective in binding CD4 (red circles) or CXCR4 (black diamonds); the PIs have varying proportions of Env defective in binding CD4 (blue squares) or CCR5 (magenta diamonds) or in respect of the fusion function of gp41 (orange triangles).
A, F and K: n=5. B, G and L: n=9. C, H and M: n=15. D and I: n=45, the threshold L varied from 1 to 16. E, J and N: n=45, the threshold varied from 29 to 45.