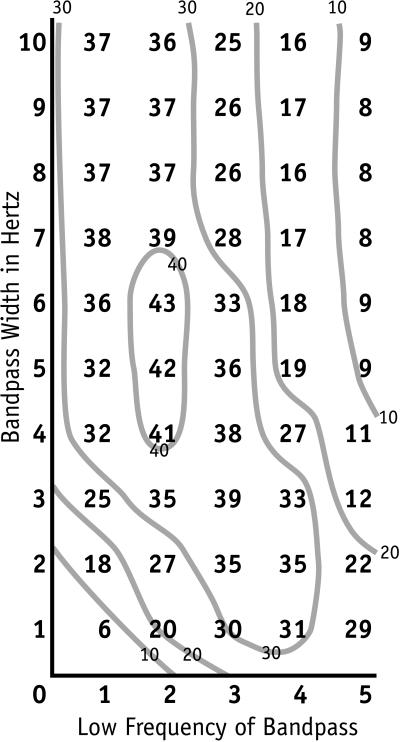
Figure 2.
Contour map of recognition-rate surface for bandpass filter parameters L and W for the separately averaged (SepAS) prototypes and test samples in experiment III. The x coordinate is the low frequency (L) in Hz and the y coordinate is the width (W) in Hz of a possible filter. The number plotted at a point on the map is the number of test samples, of 48 possible, correctly recognized with the Butterworth filter whose parameters are the coordinates of the point. The prediction at that point is that of the best bipolar pair of sensors, for that filter, so the surface shown optimizes the choice of bipolar pair for the parameters of a given filter. The single best prediction, 43 of 48, was made by the bipolar pair C4–T6.

