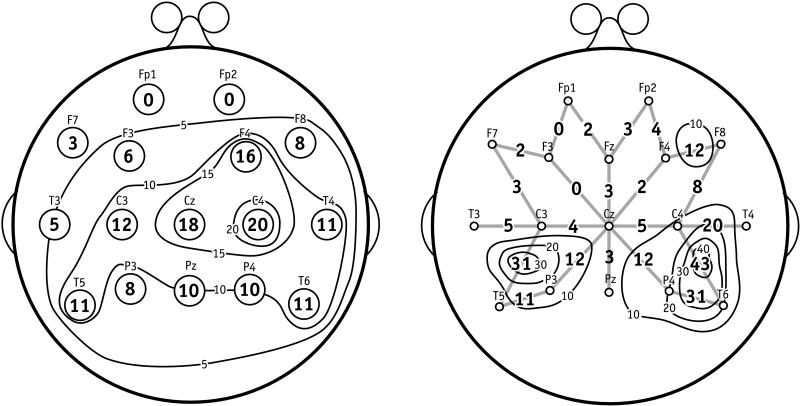
Figure 3.
Contour maps of recognition-rate surfaces for experiment II (Left) and experiment III (Right). Left shows 16 sensors of the 10–20 EEG system; Right shows 22 bipolar pairs of the 10–20 system. In both cases, the number plotted next to the location of a sensor (Left) or at the midpoint of the segment joining a bipolar pair (Right) is the number of test samples of sentences correctly recognized.

