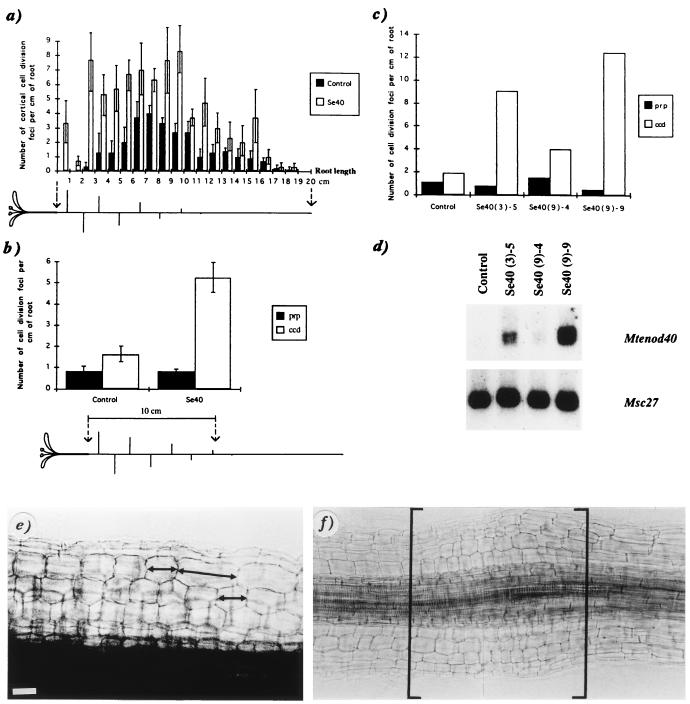
Figure 2.
Correlation between Mtenod40 overexpression and cortical cell division under nitrogen limitation. (a) Number of cortical cell division along the main root for three controls and three independent enod40 plants (Se40) as a function of the distance from the hypocotyl (mean ± SEM). The increase in the number of cortical cell divisions cosegregated 1:1 with the level of transgene expression in the progeny (data not shown). (b) Numbers of cell division foci (ccd, cortical cell divisions, or prp, putative root primordia), in the main root along the first 10 cm below the hypocotyl, for four controls and six independent transgenics (progenies of transgenic lines Se40–3, Se40–9, and Se40–10; mean ± SEM). A plant, with main and lateral roots, is schematically represented below the graph (a and b). (c) Numbers of cell division foci (ccd or prp), along the upper 10 cm of the root, for three transgenic individuals (progeny of Se40–3 and Se40–9) and one control individual. Roots were used for microscopical analysis, and the leaves were used for Northern blot analysis (d) of these individual plants. Root region of an enod40 transgenic plant showing different sizes of cortical cells (e) and an increased diameter due to extensive cortical divisions (in brackets) (f). [Bar = 20 μm (e) and 40 μm (f).]

