Figure 3.
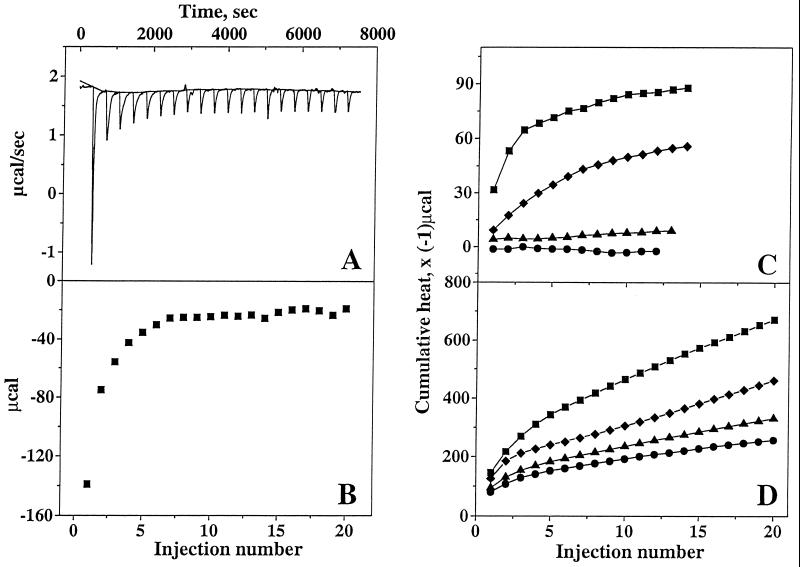
Titration calorimetry. (A) Titration calorimetry of Aβ1-40 (30 μM) with small unilamellar lipid vesicles. Each peak corresponds to the injection of 10 μl of lipid dispersion into the calorimeter cell containing Aβ1-40. (B) Evaluation of the heat of reaction from the area under each peak. (C and D) Cumulative heats of reaction deduced from calorimetric titrations of Aβ25-35 (50 μM) (C) and from calorimetric titrations of Aβ1-40 (30 μM) (D) with small unilamellar lipid vesicles [lipid composition POPC/POPG (75:25, mol/mol), lipid concentration 40 mM (▪)], with phloretin-pretreated lipid vesicles [phloretin/lipid, 1:10, mol/mol (▴), or phloretin/lipid, 0.5:100, mol/mol (⧫)], and with exifone-pretreated lipid vesicles [exifone/lipid, 0.5:100, mol/mol (•)]. Measurements were performed in 10 mM sodium acetate buffer (pH 5.0) at 28°C.

