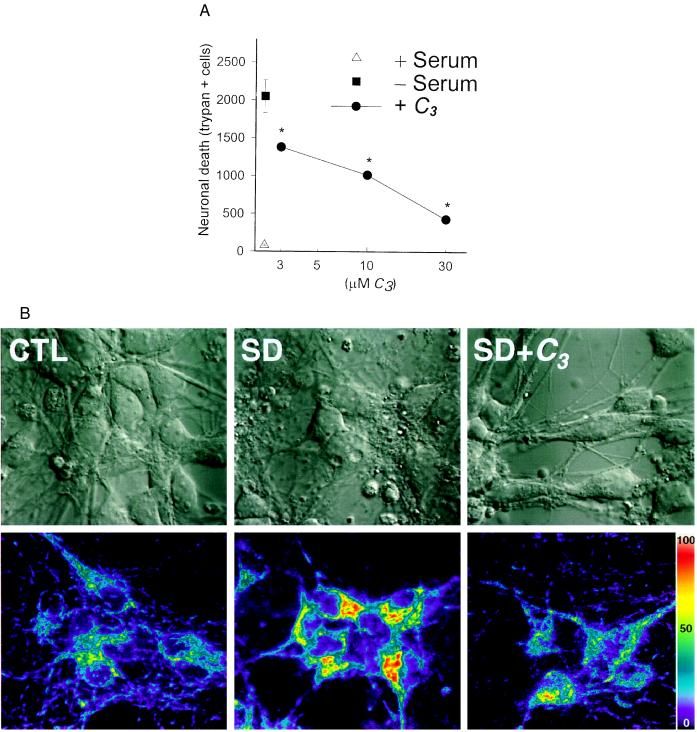
Figure 6.
C3 attenuated neuronal death (A) and dihydrorhodamine oxidation (B) induced by serum deprivation. Cell death was determined by manual cell counts of trypan-stained neurons 48 hr after onset of serum deprivation. ∗, P < 0.05 vs. serum deprivation, using ANOVA followed by Student–Newman–Keuls test for multiple comparisons. Values are mean ± SEM, n = 4–8 per condition. Figure is representative of two additional replicates. Confocal images (B) of cortical neurons showing Nomarski images (Upper) of neurons before (CTL) and 8 hr after the onset of serum deprivation (SD). Neurons in the SD condition demonstrate typical apoptotic features, including membrane blebbing and condensation of nuclear contents. (Lower) Concurrent photomicrographs show increased fluorescence due to oxidation of preloaded, nonfluorescent dihydrorhodamine to fluorescent rhodamine 123. Rhodamine fluorescence is quantified with a linear pseudocolor scale corresponding to arbitrary fluorescence intensity units.

