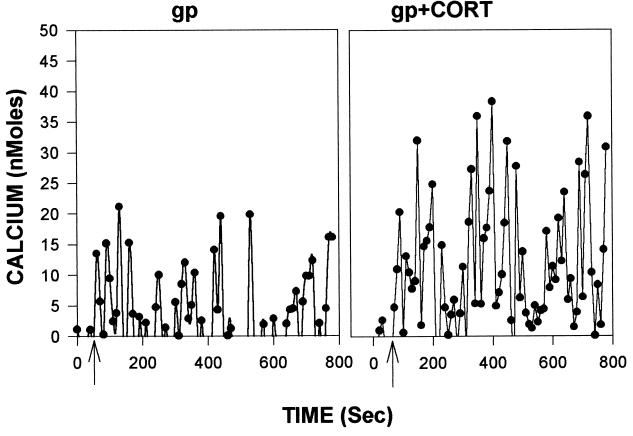
Figure 2.
Representative calcium response of a hippocampal neuron exposed to gp120 with (Right) or without (Left) prior exposure to 1 μM corticosterone for 24 h. Data are presented after subtraction of the average of the five initial basal readings (which averaged between 50 and 100 nM in these studies).

