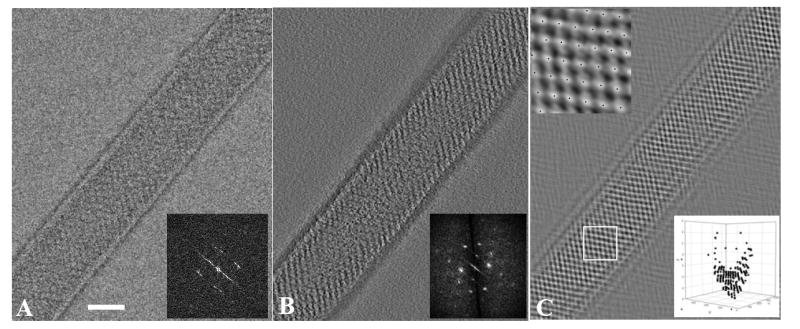
Figure 2. Images of two-dimensional crystals of Kdp.

(A) Projection image of negatively stained Kdp crystals taken from a tomographic data set corresponding to zero tilt. In order to avoid excessive beam damage, the dose for each image was limited to ~2 e-/Å2, accounting for the relatively noisy appearance of this image. The corresponding Fourier transform is shown in the inset, revealing a number of discrete reflections, which are blurred due to the residual curvature in the plane of the crystal. (B) A 0.7-nm thick slice from the 3D tomographic reconstruction near the surface of this Kdp tube. The corresponding Fourier transform is shown in the inset and reveals Fourier reflections to ~3 nm resolution. The lattice was used to construct a mask for the 3D Fourier transform, which in turn produced a filtered image for a cross-correlation reference. (C) 2D projection of the resulting cross-correlation map reveals the location of each unit cell across the crystal. Individual peaks are marked by black dots and are visible in the higher magnification image in the upper inset. The lower inset shows a 3D plot of unit cell positions from a region in the middle of this crystal; the viewing angle of this plot corresponds to the tube axis. Note that unit cells have a higher Z coordinate at the edges of the tube, illustrating the residual curvature.
