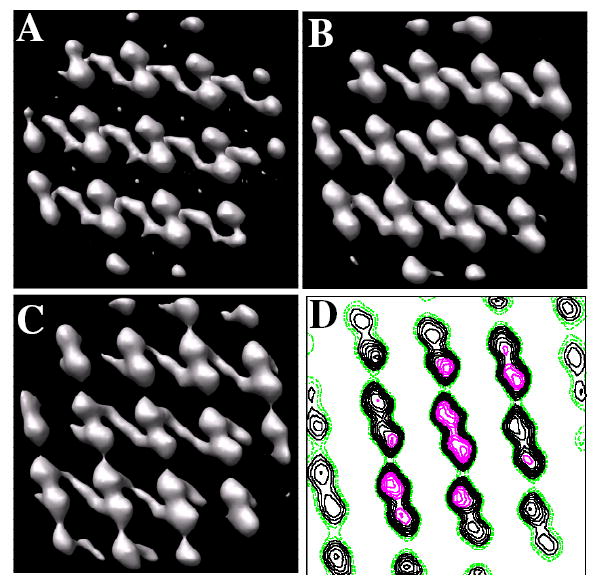
Figure 3. Kdp motifs used for real-space averaging.

Based on the cross-correlation map in Fig. 2, 3D motifs were extracted from the tomographic map consisting of ~12 unit cells (42×42×28 nm3). (A) Initial reference for alignment of motifs from an individual tomogram was generated by simply averaging the motifs extracted according to their positions in the cross-correlation map. (B) Averaged motif from an individual tomogram after two rounds of alignment. (C) Averaged motif from the combination of six tomograms. The unit cell appears to consist of dimers, although no two-fold symmetry has been applied. Strong connections are apparent in the horizontal direction. Because these crystals have been negatively stained, the transmembrane region is not visible in these maps. Thus, connections between unit cells in the vertical direction, which are not visible in this map, most likely occur within the transmembrane region. (D) Contour plot of one 0.7-nm slice through the map. Stronger density is seen in the middle of the map due to the use of a Gaussian mask during alignment steps; slight differences in unit cell parameters for individual crystals lead to a blurring at the edges of the map and therefore a loss in contrast.
