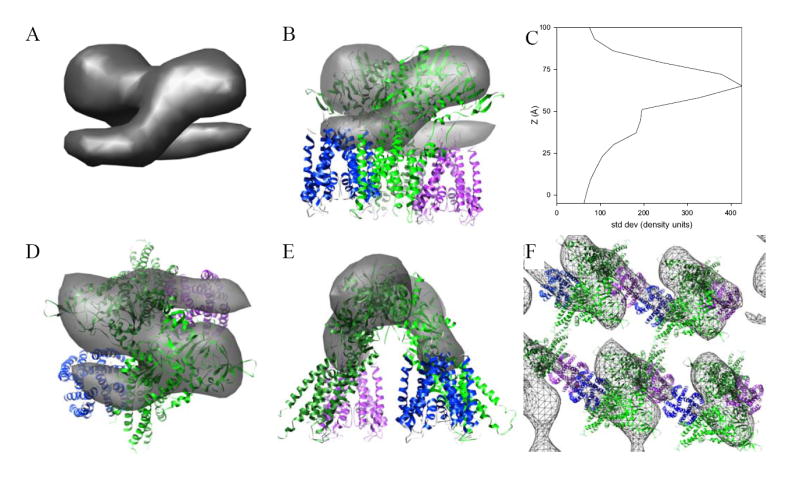
Figure 5. Fitting a model for Kdp to the tomographic map.

(A) The asymmetric unit has been masked from the unit cell and shown in a view parallel to the membrane surface. Overall height of this structure is 6-7 nm and appears to consist of a symmetric dimer. (B) Fitting of pseudoatomic models for KdpA and KdpB to this dimeric structure. The KdpA model corresponds to the published X-ray crystal structure of KcsA (blue and magenta) and the KdpB model has been based on an X-ray crystallographic structure of Ca2+-ATPase in the E2 enzymatic state with several deletions (light and dark green). This view is parallel to the membrane surface. (C) Plot of contrast present in the tomographic reconstruction along the membrane normal. Contrast was defined as the standard deviation of densities within each 0.7-nm section from the final averaged structure. (D) Top view, normal to the membrane plane, of the fitted structure shown in (B). (E) View of the structure in (B) rotated 90° about the vertical axis. (F) View of the crystal lattice normal to the membrane. Although the dimer is mediated by interactions between cytoplasmic domains of KdpB subunits, the crystal lattice is mediated in the horizontal direction by interactions between KdpA subunits and in the vertical direction by the membrane domain, which are not visible in this map.
