
FIG. 2.
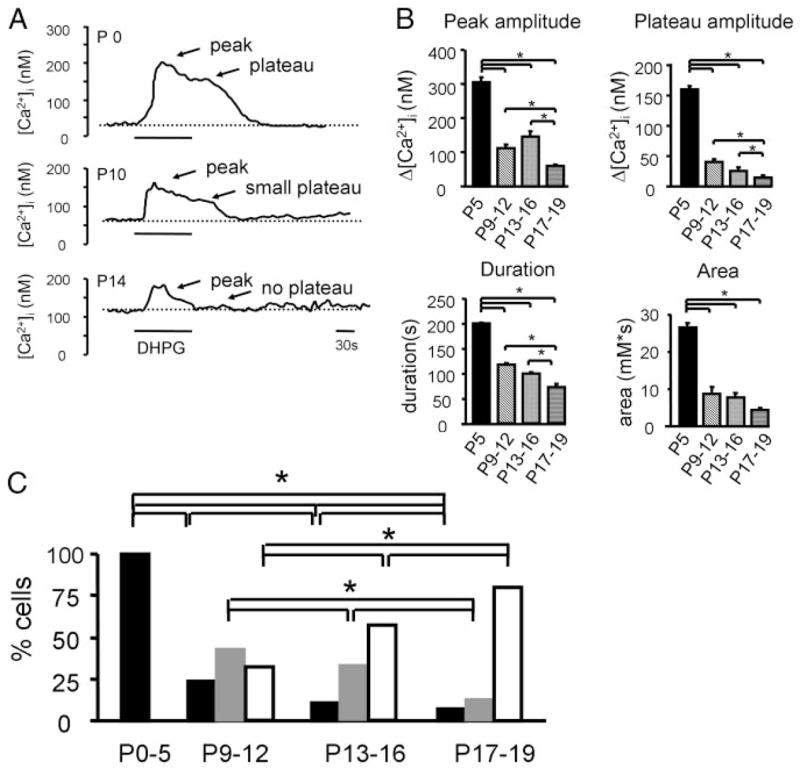
Developmental changes of group I metabo-tropic glutamate receptor (mGluR)–mediated Ca2+ responses in LSO neurons. A: example of DHPG-elicited (50 μM, 90 s) Ca2+ responses in 3 LSO neurons, each from a P0, P10, and P14 mouse. Responses undergo a transition from a profile characterized by peak and plateau (pp) to a profile characterized by a smaller peak and a smaller plateau (psp), and finally to a profile characterized by a peak only [peak and no plateau (pnp)]. Dotted line indicates baseline Ca2+ levels. B: group data of peak amplitudes, plateau amplitudes, area, and duration of DHPG-evoked Ca2+ responses at different ages. Number of cells in each age group: P0–P5: 222; P9–P12: 165; P13–P16: 135; P17–P19: 54 (asterisks: P < 0.05, ANOVA). C: developmental changes in the percentage of pp-type (black bars), psp-type (gray bars), and pnp-type (white bars) responses (asterisks: P < 0.05, chi-square test). Number of cells in each age group: P0–P5: pp n = 222; P9–P12: pp n = 46; psp n = 75, pnp n = 59; P13–P16: pp n = 15, psp n = 42, pnp n = 75; P17–P19: pp n = 4, psp n = 7, pnp n = 43.