
FIG. 3.
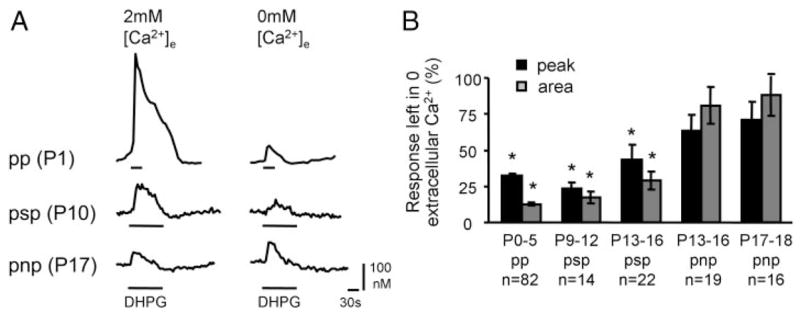
Developmental changes in the contribution of extracellular Ca2+ to group I mGluR-mediated Ca2+ responses. A: examples of individual responses to DHPG application in 2 mM extracellular Ca2+ (left traces) and in 0 mM Ca2+ (right traces). B: peak and area of Ca2+ responses after removal of extracellular Ca2+ as a function of age and response type. n, number of cells. Asterisks: P < 0.05 (paired t-test)