Figure 1.
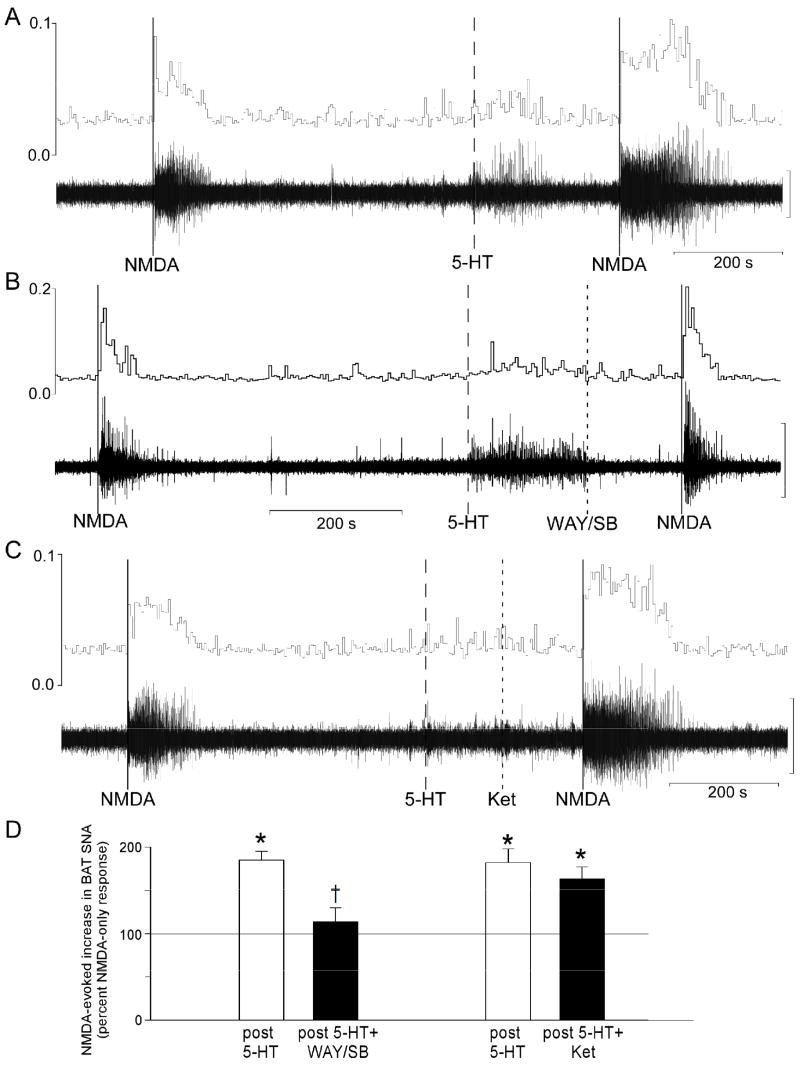
Representative examples of BAT SNA during microinjections of NMDA (solid lines) into the intermediolateral nucleus at the fourth thoracic segment (T4 IML). (A) The NMDA-evoked increase in BAT SNA was potentiated by prior microinjection of 5-hydroxytryptamine (5-HT) into the T4 IML (dashed line). (B) This potentiation was prevented by microinjection of the 5-HT1A receptor antagonist, WAY-100635 plus the 5-HT7 receptor antagonist, SB-269970 into the T4 IML (dotted line). (C) Microinjection of the 5-HT2A receptor antagonist, ketanserin into the T4 IML (dotted line) did not attenuate the 5-HT-evoked potentiation of the NMDA-evoked increase in BAT SNA. Vertical scale bar for BAT SNA represents 100μV in panels A, B, and C. (D) Magnitudes of the BAT SNA responses to NMDA were determined as the area under the curve (AUC) of the root mean square (rms) values of BAT SNA. For each treatment, the bar height represents the mean magnitude of the NMDA-evoked increases in BAT SNA expressed as a percent of the corresponding control response elicited by microinjection of NMDA alone (i.e., prior to 5-HT). Pre-treatment groups are: 5-HT (open bar, n=6), 5-HT followed by WAY-100635 and SB-269970 (5-HT+WAY/SB, filled bar, n=6), 5-HT (open bar, n=4) and 5-HT followed by ketanserin (5-HT+Ket, filled bar, n=4).
* p<0.05 repeated measure comparison to the NMDA-only response.
† p<0.05 repeated measure comparison to the NMDA after 5-HT response.

