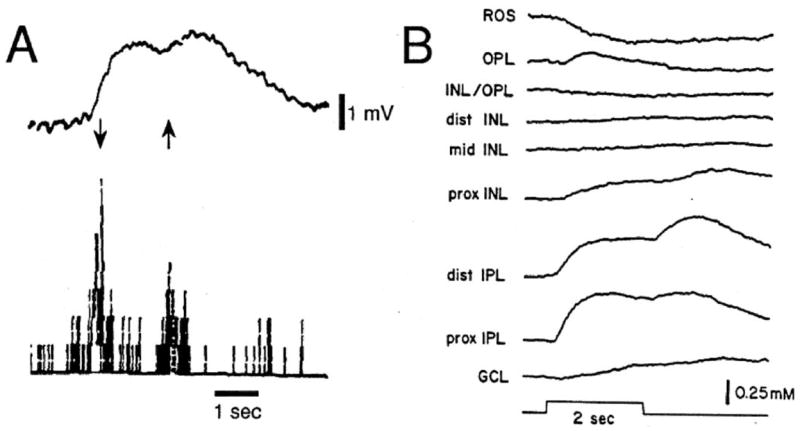
Fig. 1.

Changes in [K+]o in the cat striate cortex and frog retina with enhanced neuronal activity. (A) Upper trace. Dynamic [K+]o changes in the cat striate cortex upon stimulation of the receptive field of hypercomplex cells. [K+]o changes were measured with a double-barreled K+-sensitive microelectrode. Arrows represent bars of light moving down or up in a cell’s receptive field. The 1 mV scale bar corresponds to approximately 0.17 mM. Lower trace. Spike activity recorded in the reference barrel of the K+-sensitive microelectrode. [From Singer and Lux (1975) with permission.] (B) [K+]o changes within layers of the frog retina. A 2-s light stimulus evokes [K+]o increases in the inner plexiform layer (IPL) and outer plexiform layer (OPL) and decreases of [K+]o in the subretinal space (ROS). [From Karwoski et al. (1985), with permission.]
