
Fig. 4.
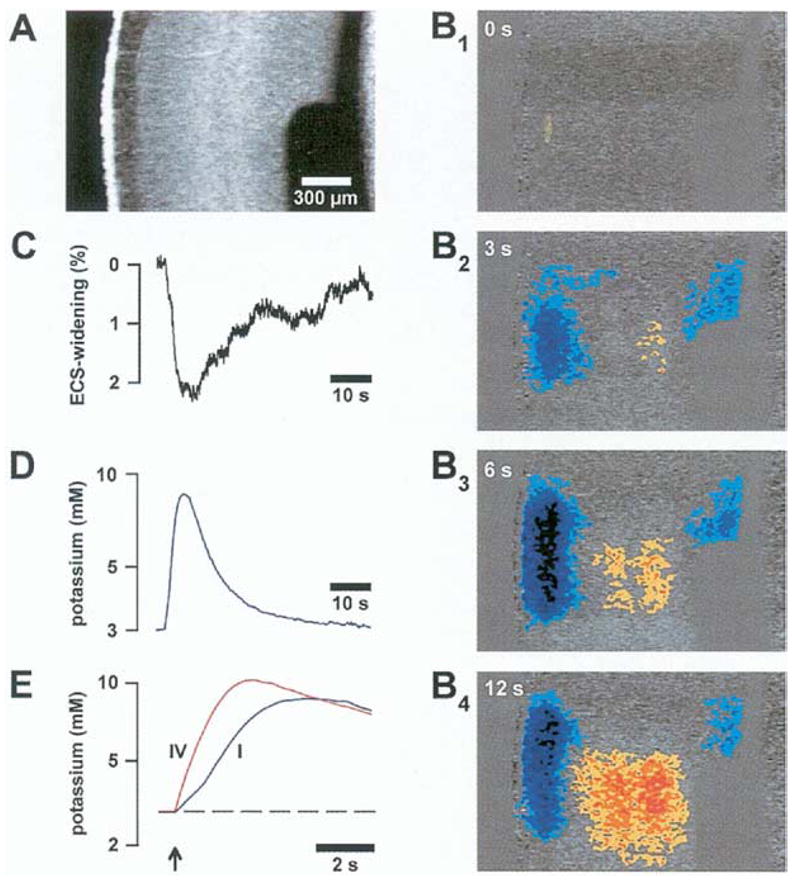
Evidences for K+ spatial buffering in the rat cortex. (A) Image of the brain slice viewed with darkfield optics. (B1–4) Time course of IOS changes upon neuronal stimulation in middle cortical layers. Red colors represent IOS increases while blue colors represent IOS decreases. These correspond, respectively, to shrinkage and widening of the extracellular space. Notice the extracellular space shrinkage in the middle cortical layers and widening in the most superficial and deep cortical layers as predicted for a K+ spatial buffering mechanism. (C) Time course of extracellular space widening in the cortical layer I measured independently validates the interpretation of IOS. (D) Time course of [K+]o increase in layer I. (E) Time course of [K ]o increase in layer I (blue) and in layer IV (red). [From Holthoff and Witte (2000), with permission.]